
-
01
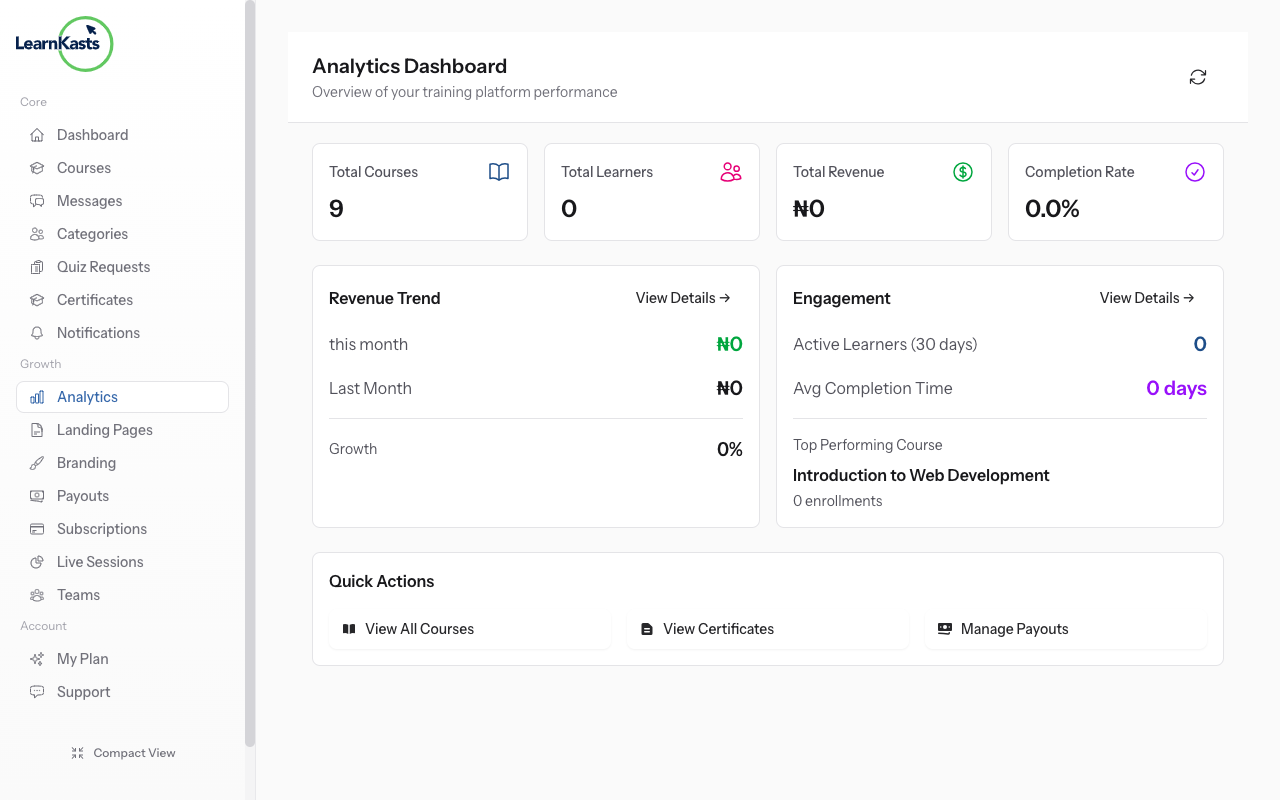
Access course analytics
Go to Educator Dashboard → Courses → Click "Edit" on your course → Click "Analytics" tab. Or click the three dots menu → "View Analytics". You'll see comprehensive data about your course performance.

-
02
View key metrics
The top row shows 4 key metrics: Total Learners (with % change), Completion Rate (% who finished), Average Rating (from reviews), and Total Revenue (with % change). These give you an at-a-glance course health check.

-
03
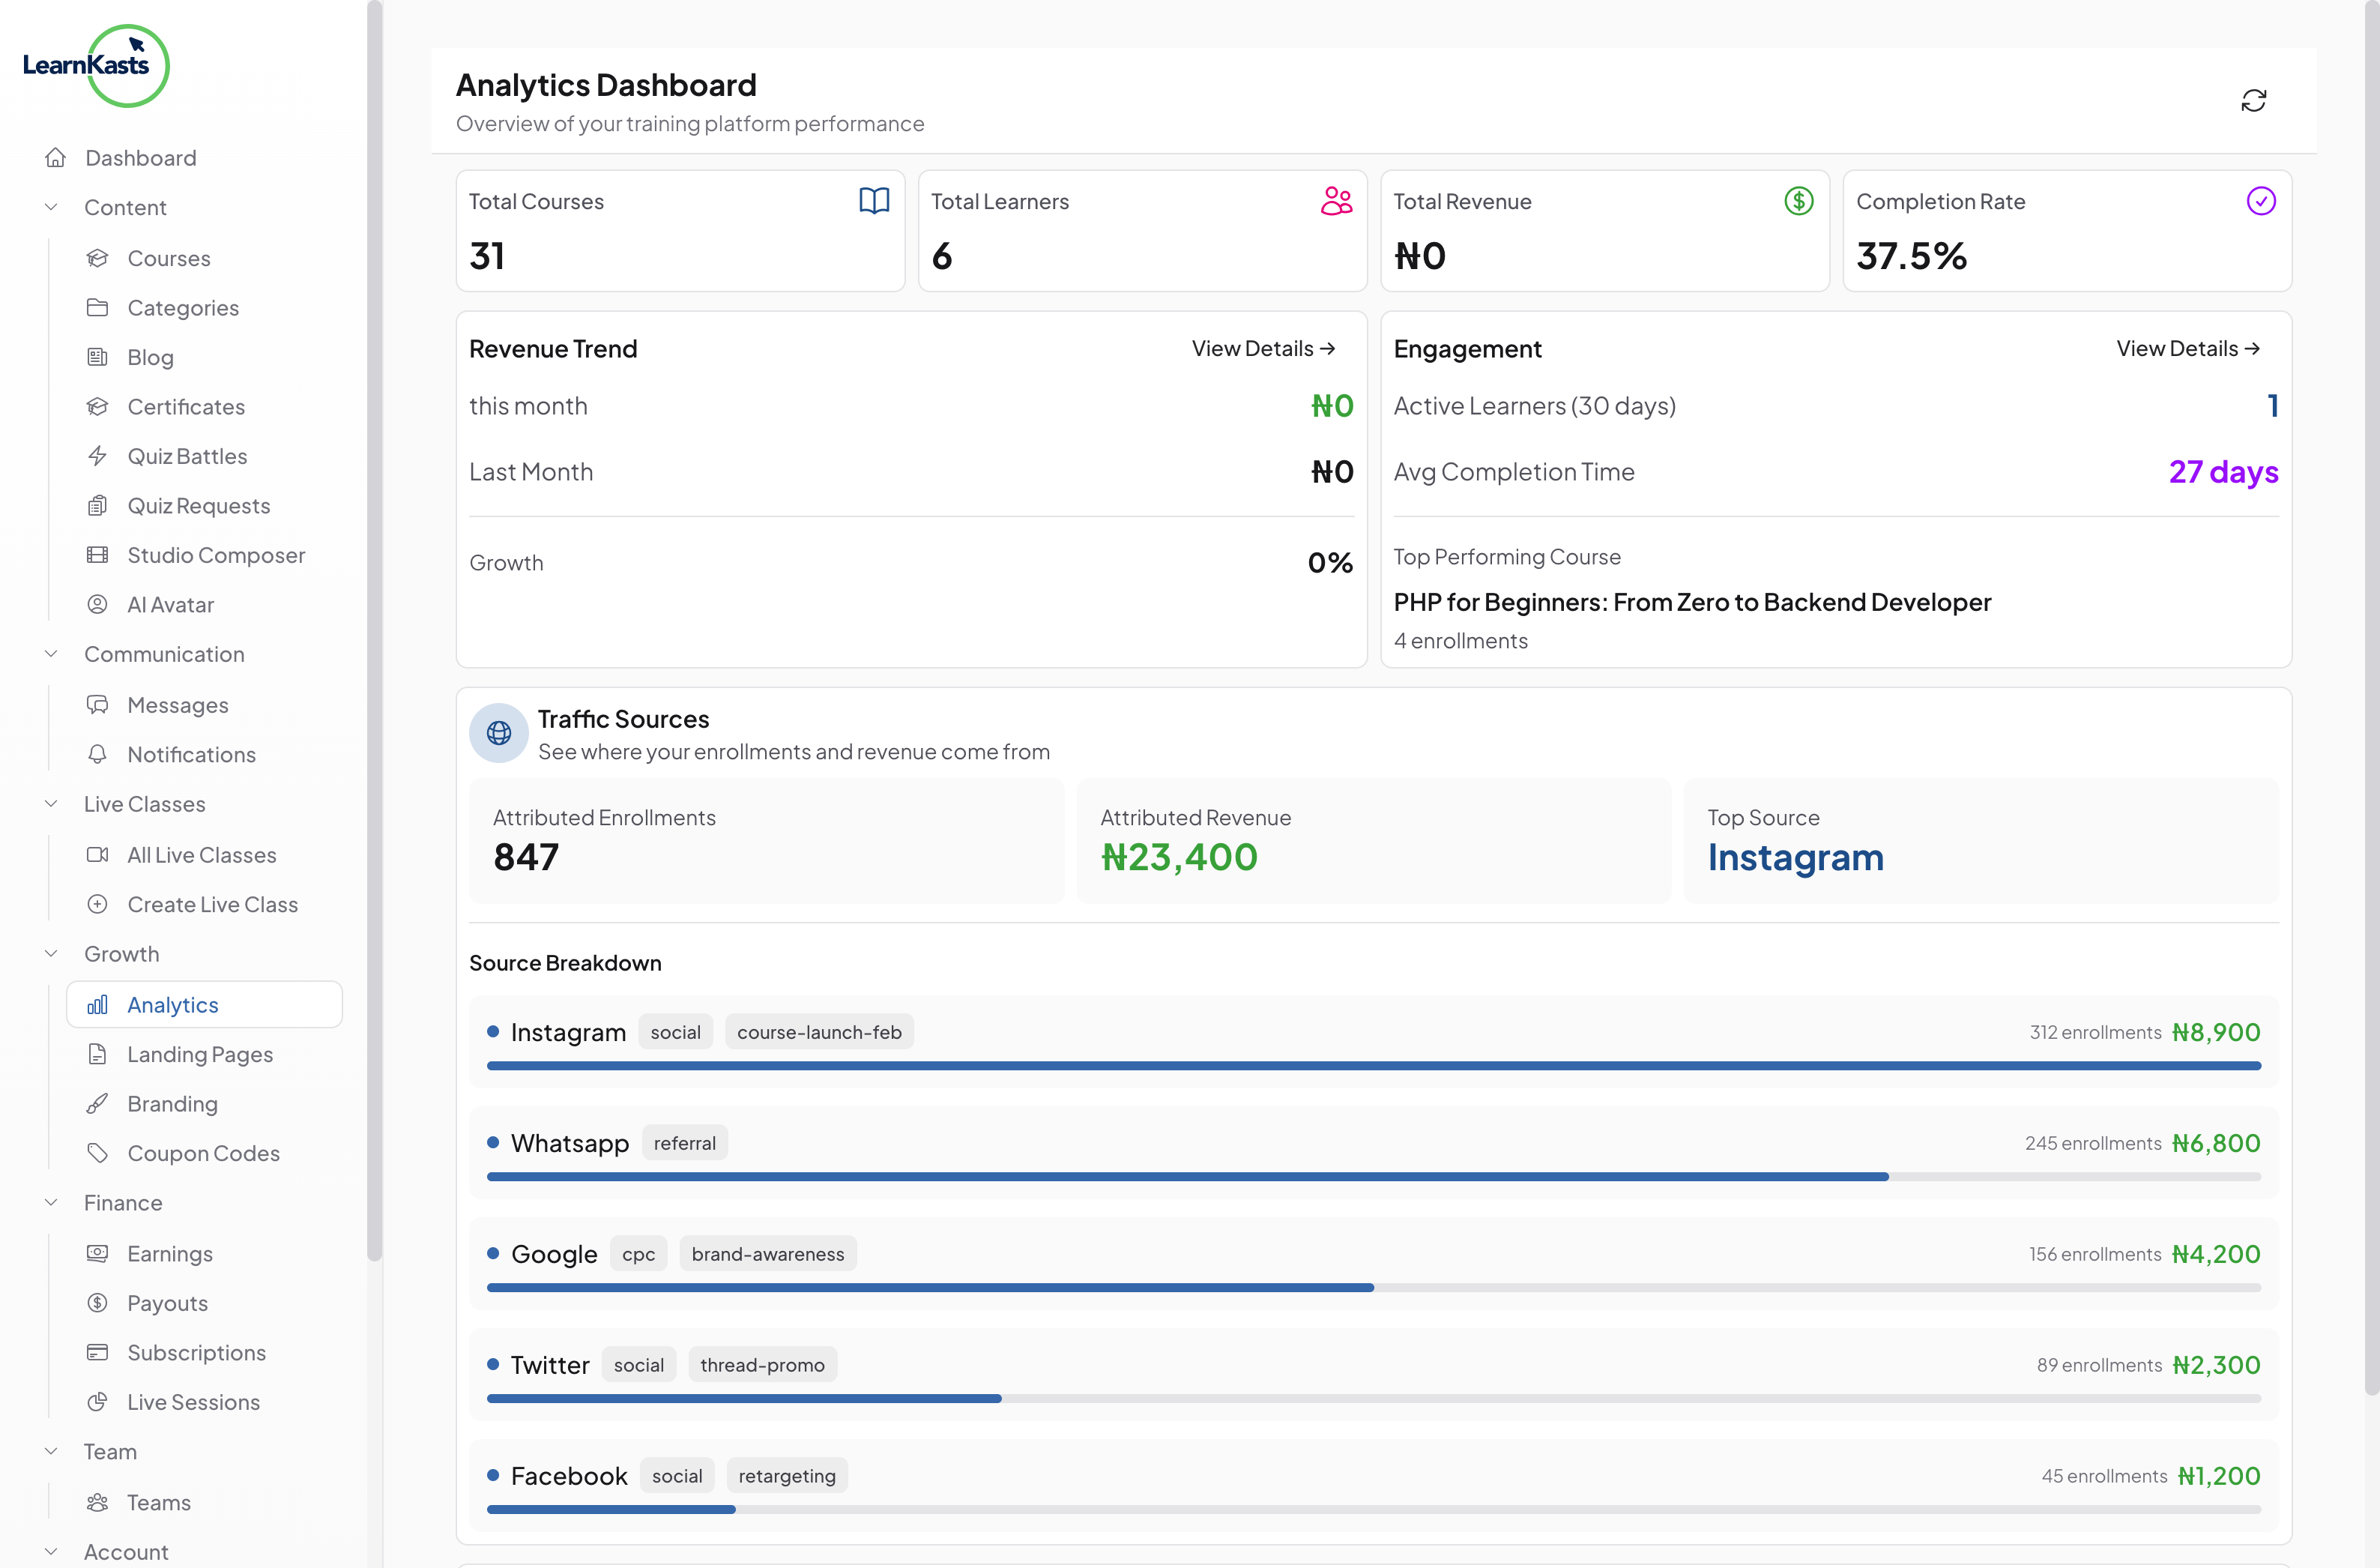
Monitor revenue trends
The enrollment trend chart shows how many students enrolled over time. Look for spikes (successful marketing campaigns) or drops (need more promotion). Use the date range selector to view different time periods.
-
04
Export analytics data
The revenue chart shows earnings over time. Compare with enrollment trends - more enrollments should mean more revenue. Track the impact of pricing changes or promotions.

-
05
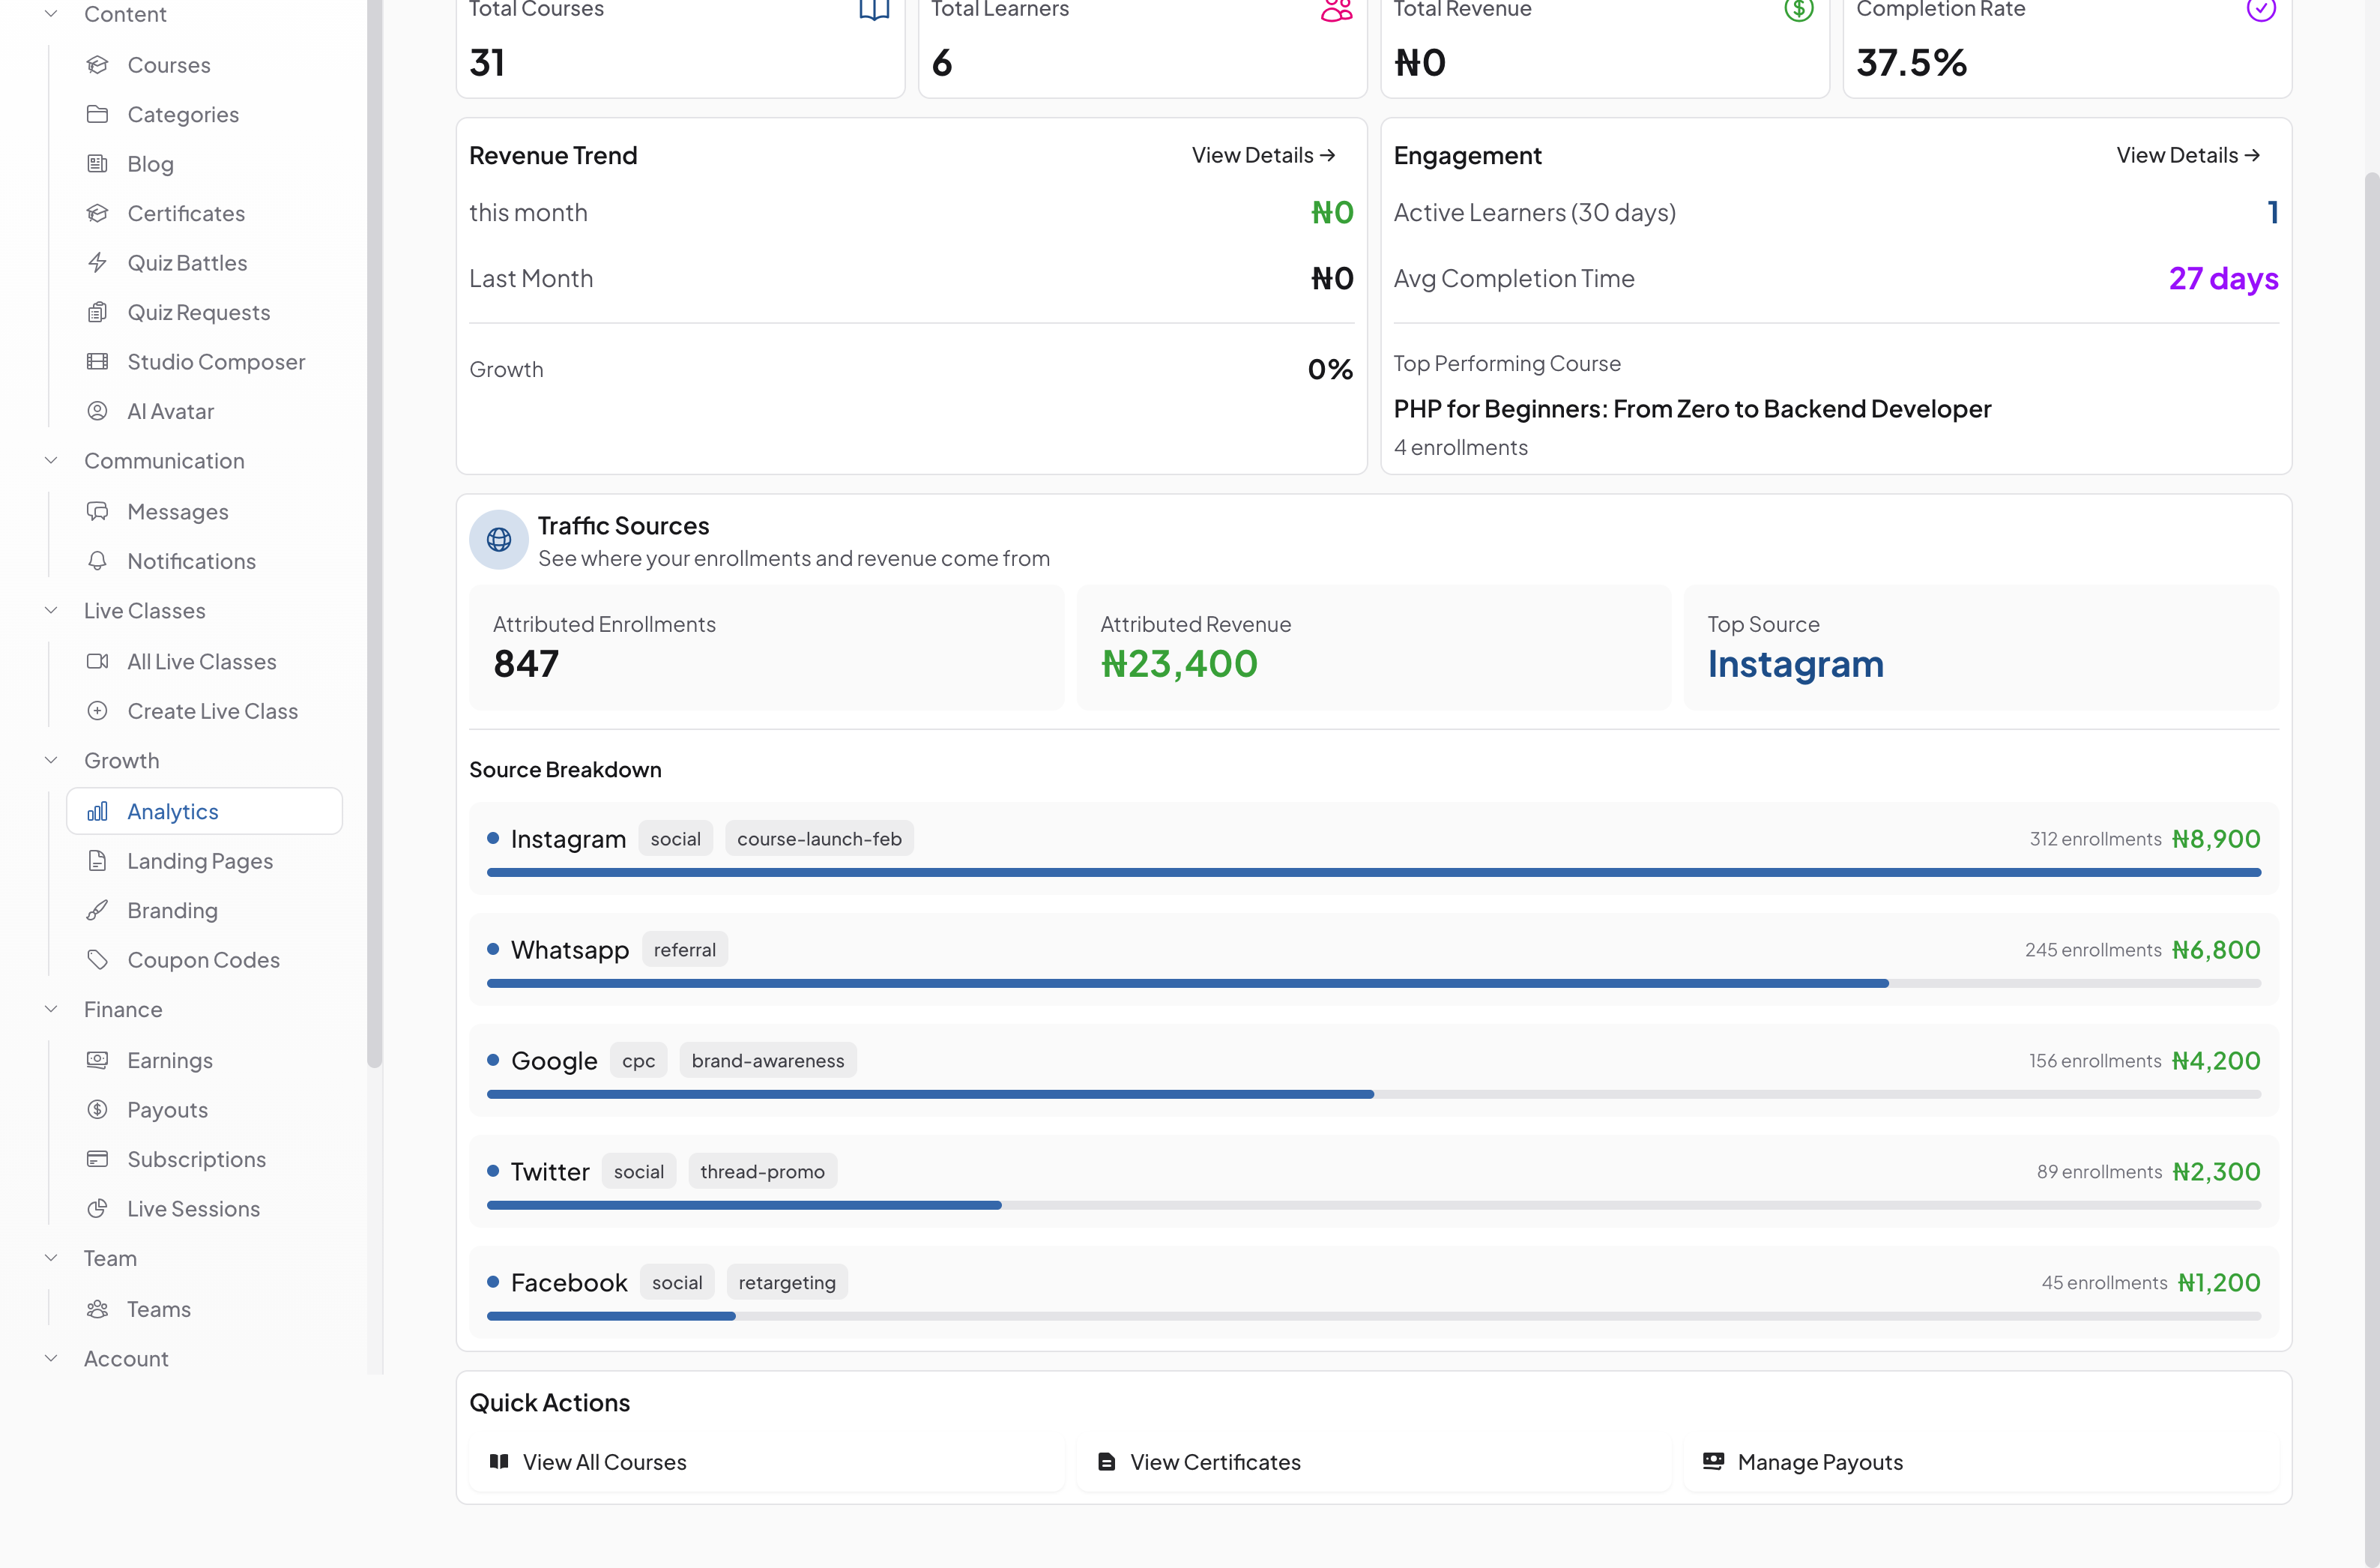
Check engagement metrics
See Average Watch Time (progress bar showing % completion), Quiz Pass Rate, and Total Notes Created. Low watch time means content might be too long. Low quiz pass rates might mean content is too difficult or unclear.
-
06
Export analytics data
Click "Export Data" to download analytics as CSV. Use this for deeper analysis in Excel/Google Sheets, creating reports, or tracking historical performance over time.
-
07
Use insights to improve
Regularly review analytics to identify: lessons with high drop-off (need improvement), quizzes with low pass rates (too hard or unclear), modules students love (make more like these). Data-driven improvements boost satisfaction.

Did this guide help?
If you need a real human, our support team replies in plain English within one working day. Faster on WhatsApp.