
-
01
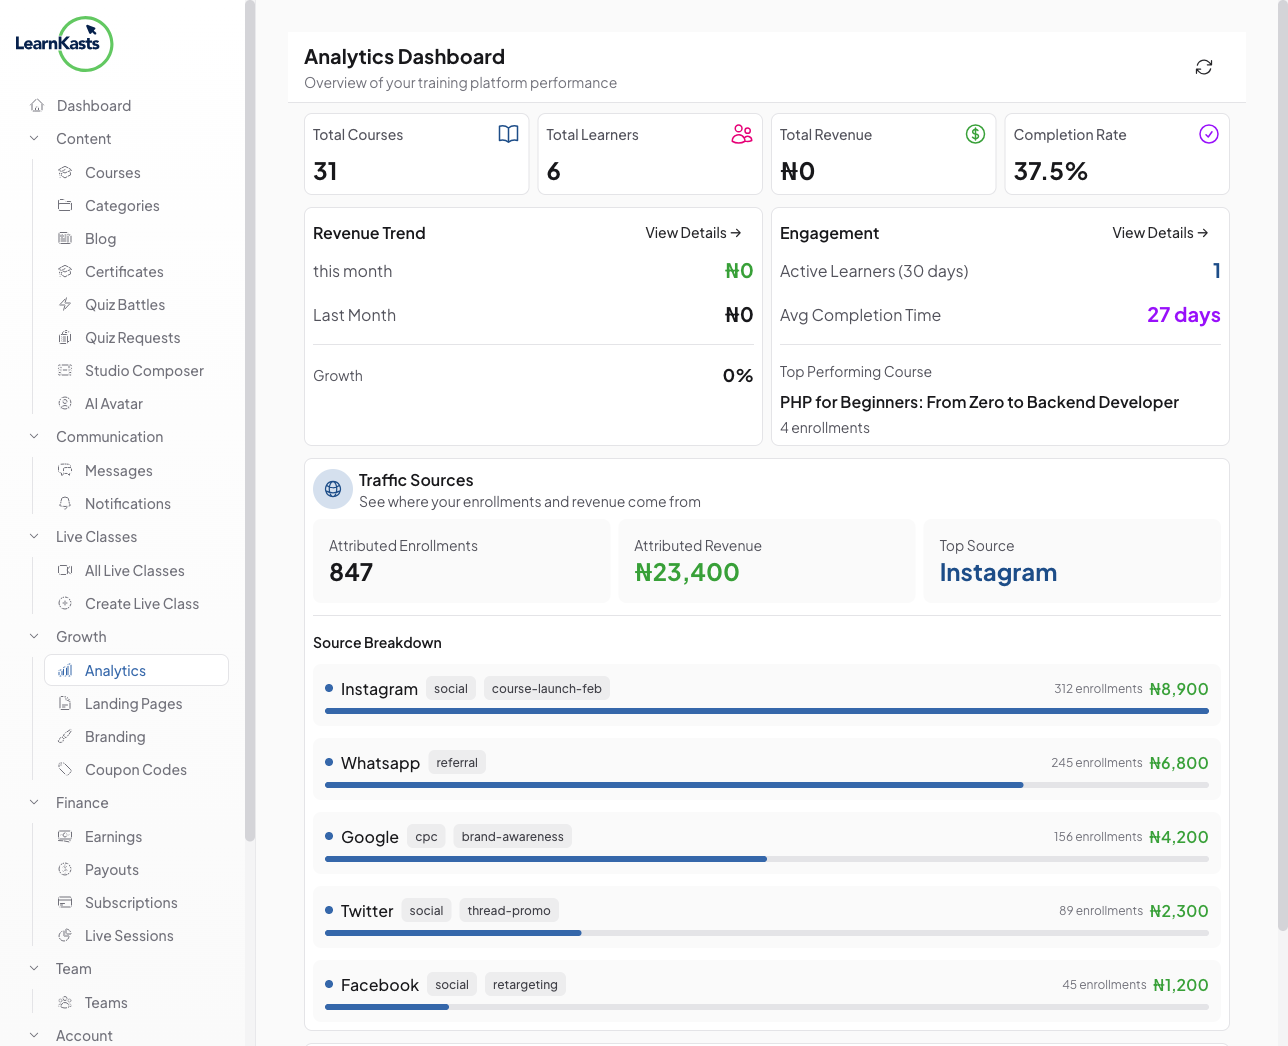
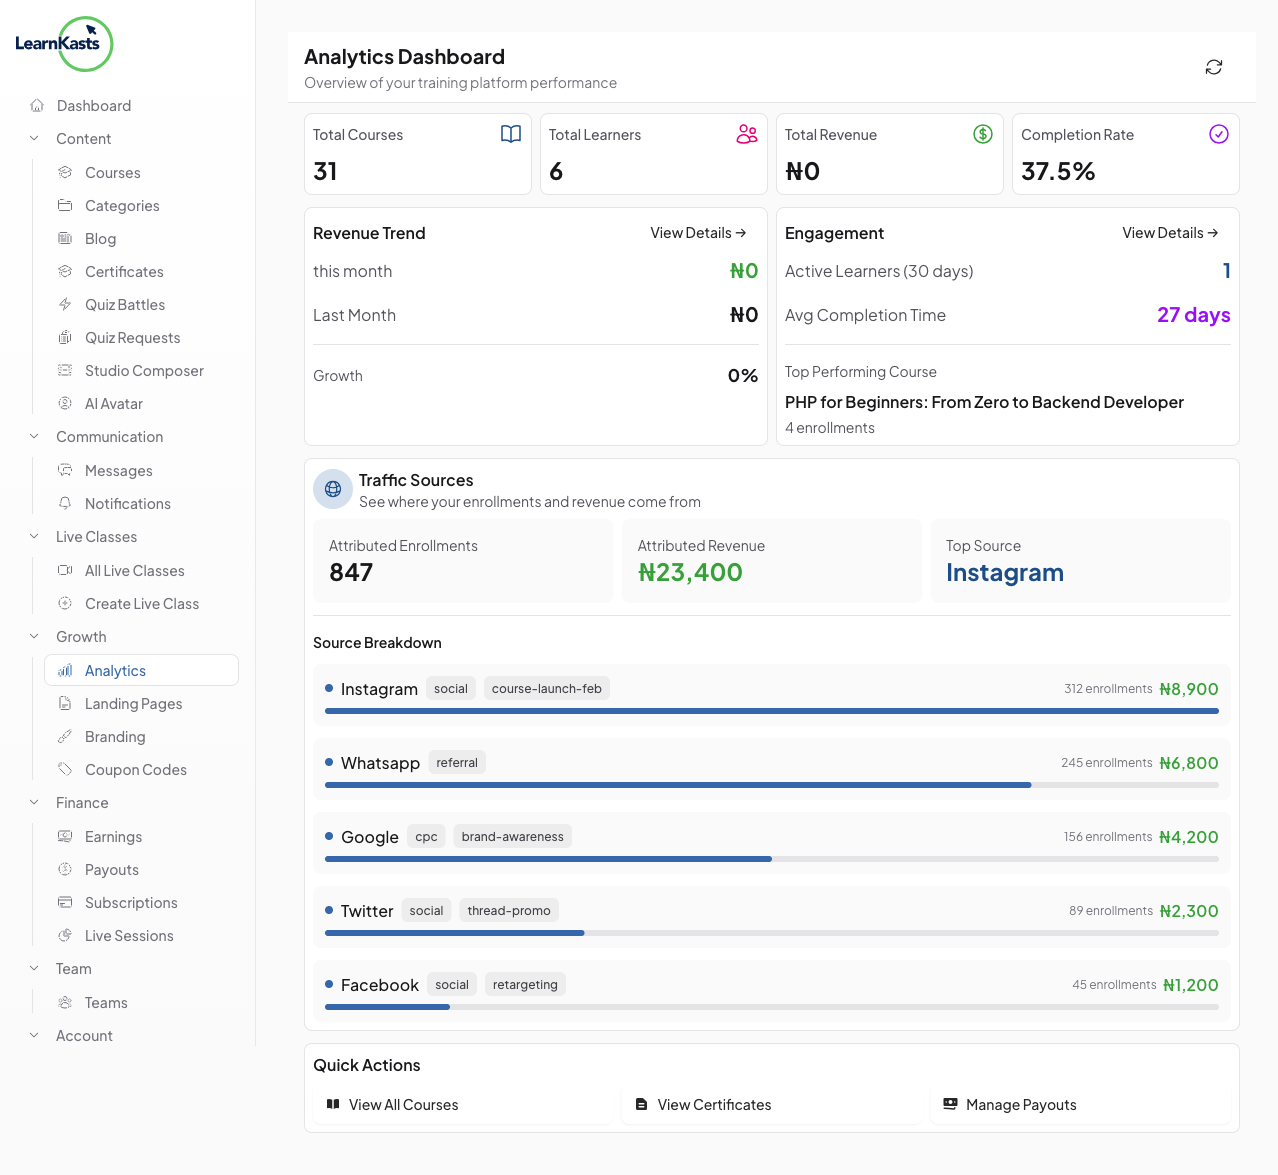
Access the Analytics dashboard
From your educator dashboard, click "Analytics" in the sidebar. The overview shows your key metrics — total revenue, student count, enrollments, and completion rates. Scroll down to find the Traffic Sources panel.
-
02
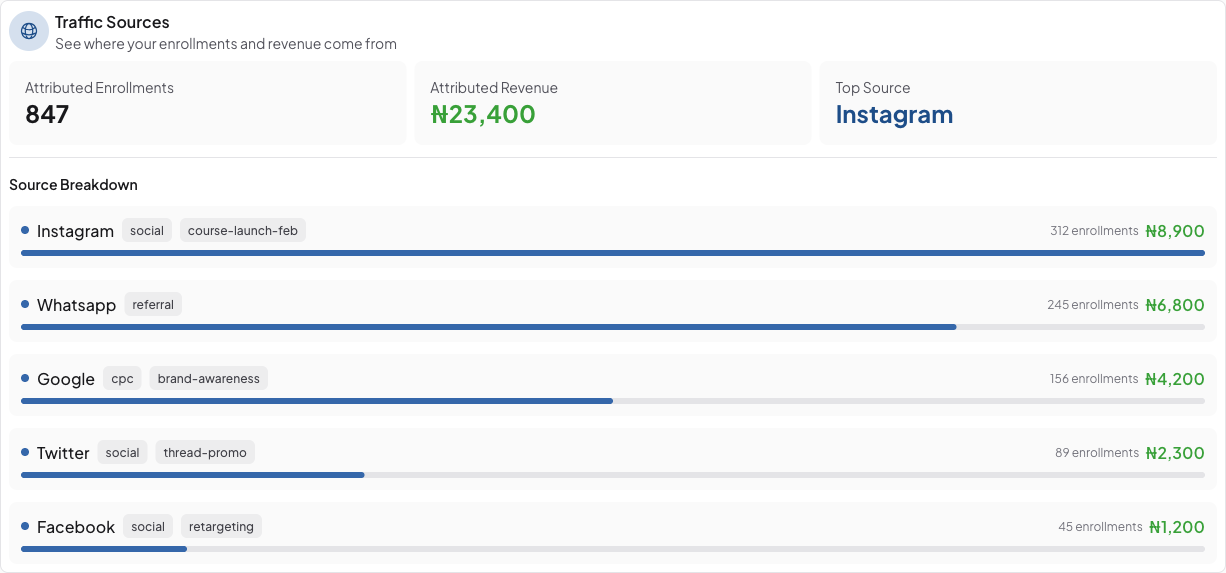
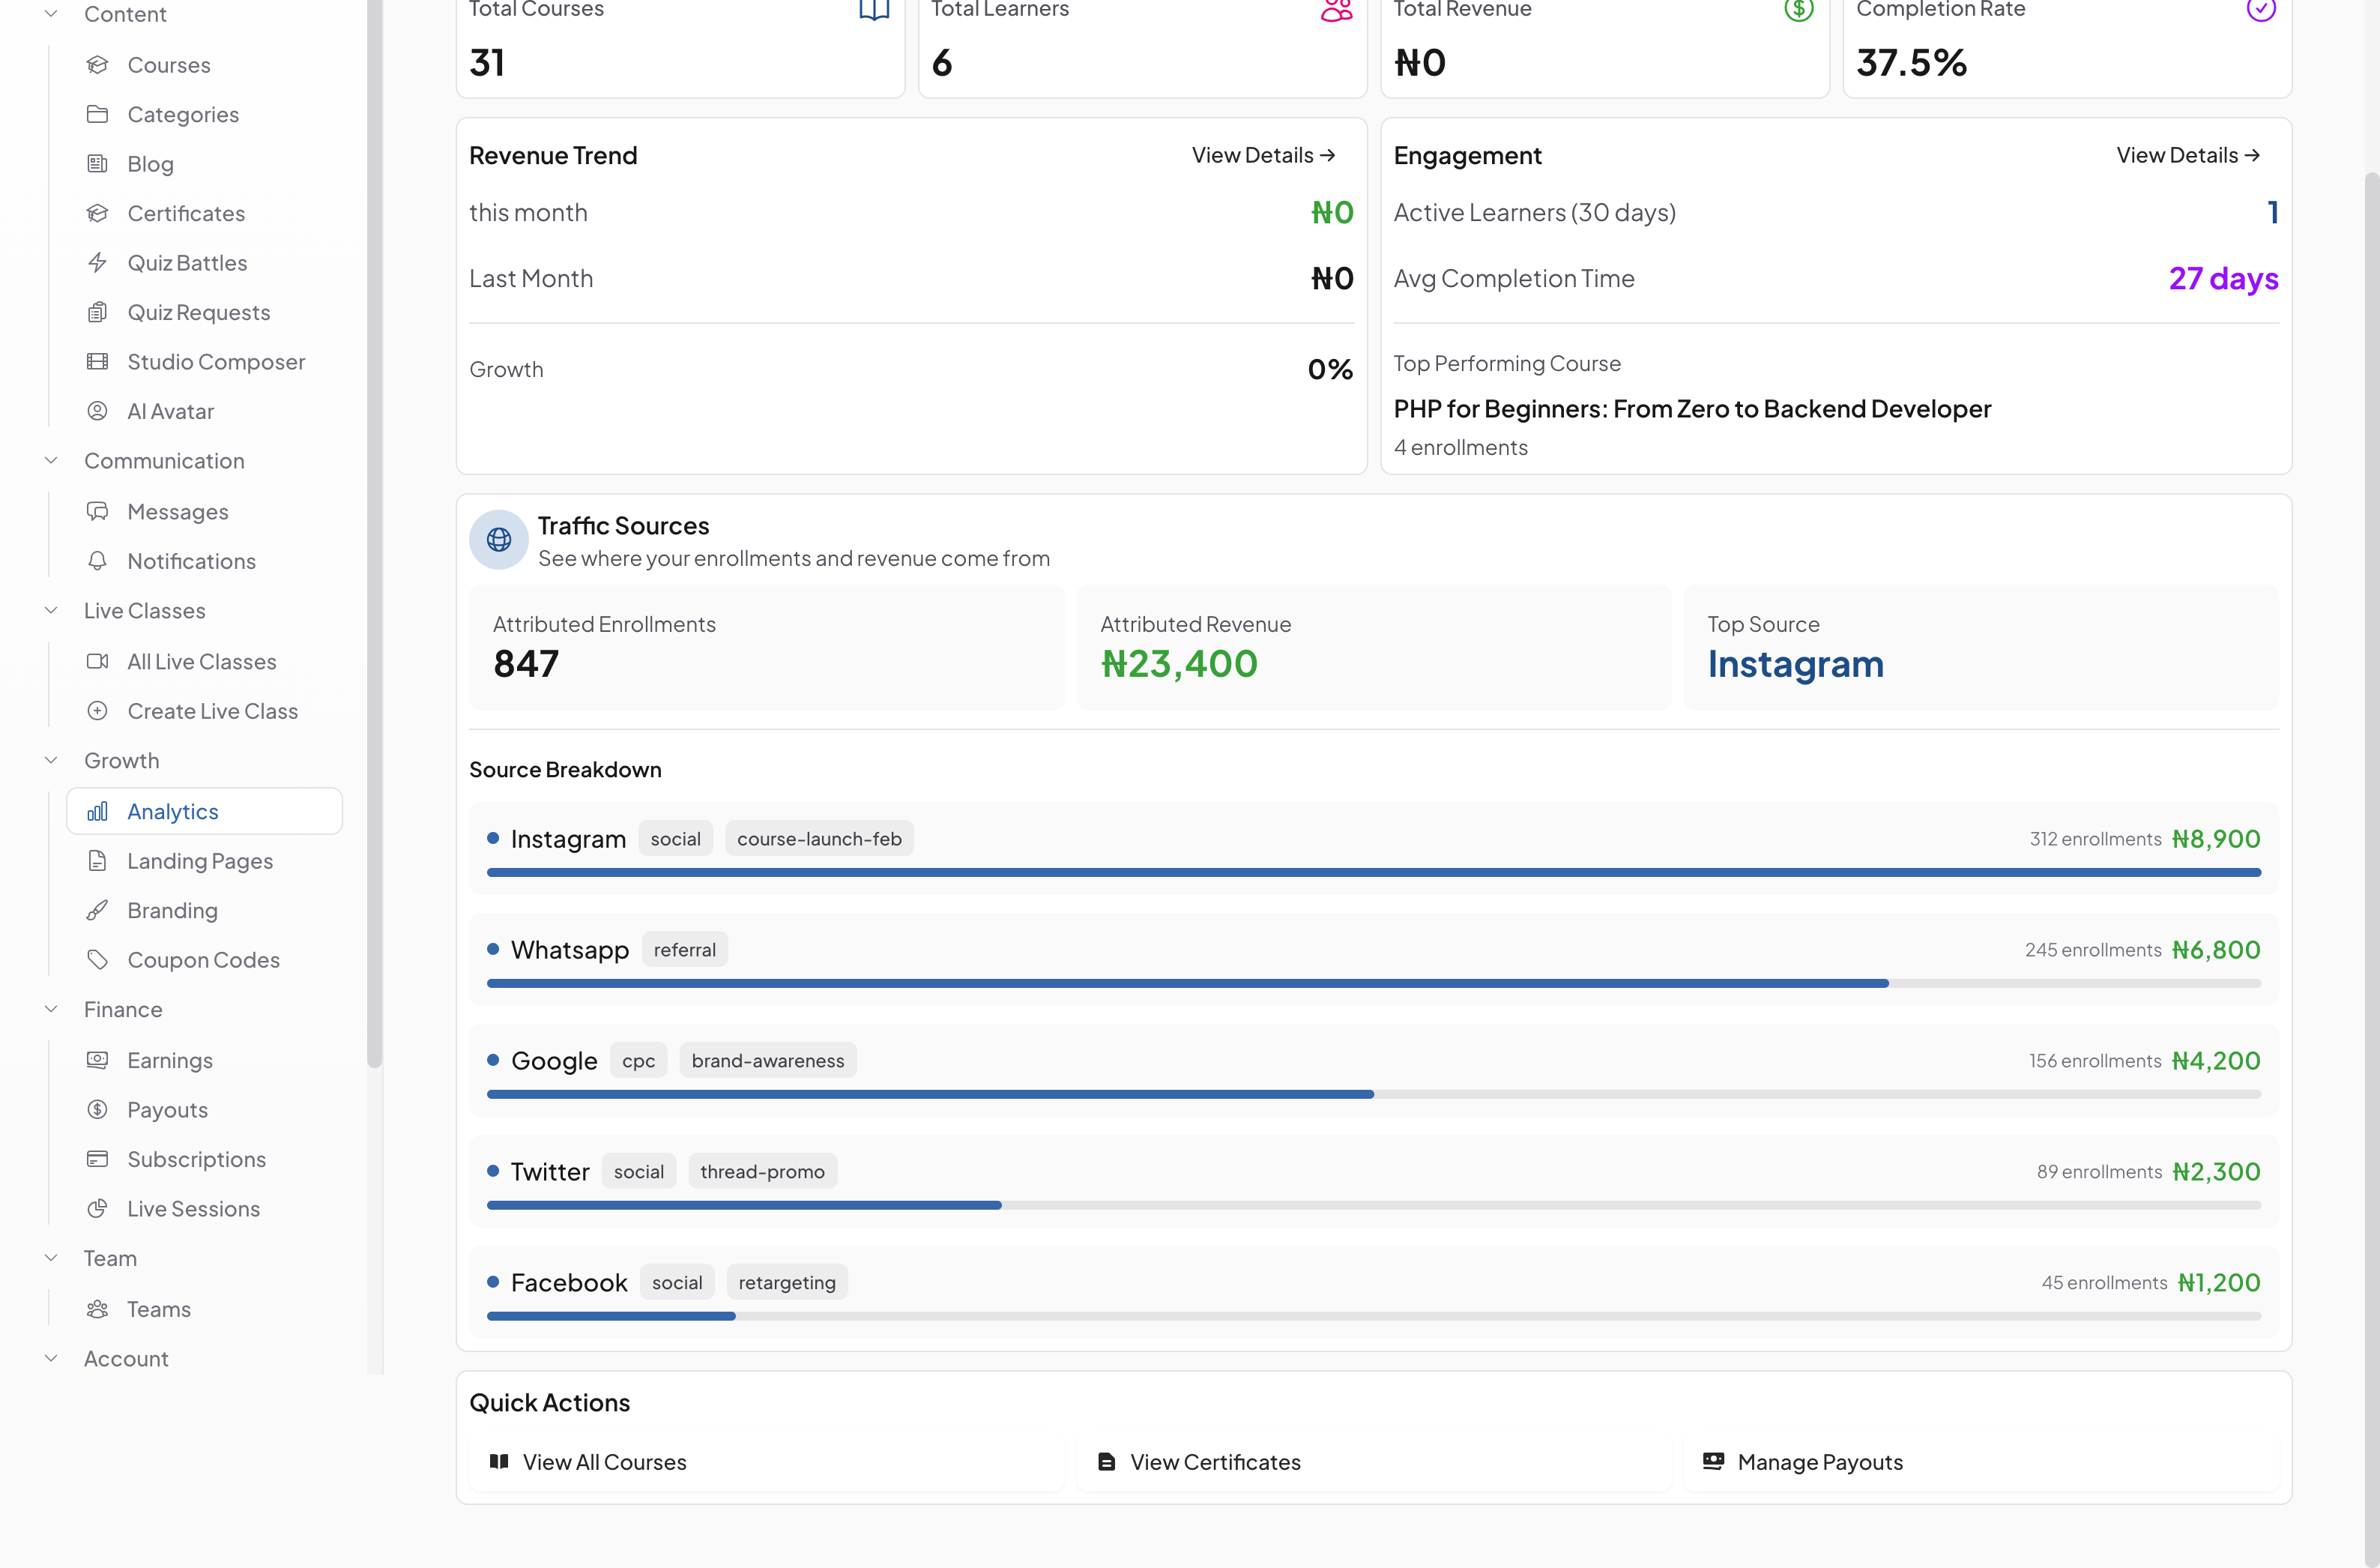
View Traffic Sources breakdown
The Traffic Sources panel shows attributed enrollments, attributed revenue, and your top-performing source. Each marketing channel (Instagram, WhatsApp, Google, Twitter, Facebook, etc.) is listed with its enrollment count and revenue contribution.
-
03
Understand UTM parameters
UTM tags (like utm_source, utm_medium, and utm_campaign) are added to your course links to track where traffic originates. For example, a link shared on Instagram would include "utm_source=instagram&utm_medium=social" so you can attribute enrollments back to that channel.
-
04
Create tracked links
When sharing your course links on social media, email, or ads, add UTM parameters to the URL. Learnkasts automatically captures these tags when students enroll, connecting each sale back to the source.
-
05
Optimize your marketing
Use the traffic source data to identify which channels drive the most revenue. Double down on high-performing sources and experiment with underperforming ones. Compare attributed revenue across channels to calculate your return on marketing investment.

Did this guide help?
If you need a real human, our support team replies in plain English within one working day. Faster on WhatsApp.